NCAA tournament puts prediction strategies to the test
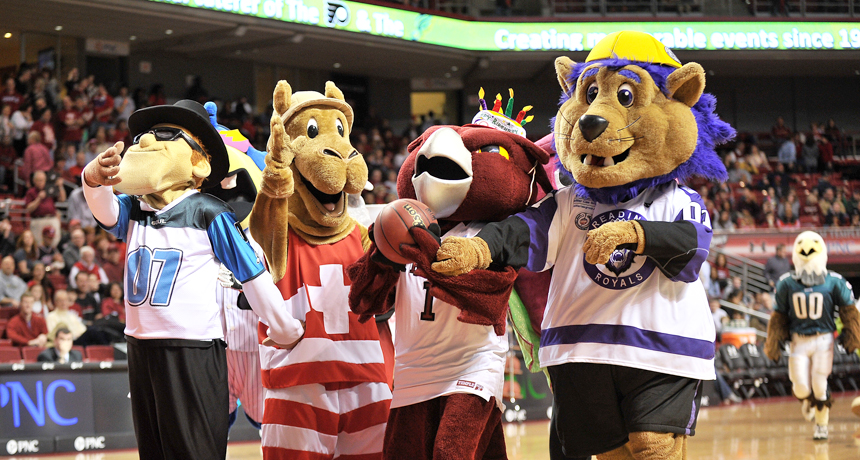
Picking the winner of a battle between mascots is one way to fill out your NCAA bracket, but data scientists use other strategies to predict all kinds of outcomes.
Aspen Photo/Shutterstock
- More than 2 years ago
Editor’s note: We’d like to introduce Culture Beaker, the latest addition to the Science News blog network. Both the blog and its author, Rachel Ehrenberg, have had previous lives at the magazine: Rachel was a staff writer from 2008 to 2013, and for the last two years of her tenure she authored a column called “Culture Beaker.” This blog will be an updated and upgraded version that aims to shine a light on the places where science and culture intersect. It will consider science relevant to the broader culture as well as cultural ramifications of new scientific findings. As Rachel writes, “We all live in the culture beaker, yo.”
The Final Four is upon us. For those of you who are immune to national sports pastimes, that’s the last four teams and impending end of March Madness, the NCAA men’s Division I college basketball tournament. Over three weeks each spring, 68 college teams compete, facing immediate elimination if they lose. Americans bet an estimated $2 billion on this year’s tourney, which like the Super Bowl or the Kentucky Derby engages people who might otherwise ignore sports. It also engages data scientists.
This year, for example, 341 math-minded teams entered an NCAA prediction contest hosted by Kaggle, an outfit that brings machine-learning might and prediction prowess to all sorts of complex problems. As mathematician Jeff Bergen of DePaul University explains, there are more than 9 quintillion ways — a 9 followed by 18 zeros — to fill out the diagram of all the NCAA tournament pairings and outcomes (aka, the bracket). A testament to the task’s difficulty: last year Warren Buffet offered $1 billion to anyone who had a perfect bracket. No one did.
The Kaggle contest is even harder than the typical office pool, in which you pick whether a team will win or lose and get points when your picks advance. Kaggle contestants have to assign a probability to each outcome. As with most predictions, you’re better off if you use some prior knowledge. If you know a little bit about sports, for example, you might take into account the fact that higher seeded teams are usually more likely to beat lower seeded teams. Such knowledge is especially helpful this year, as FiveThirtyEight’s Nate Silver pointed out, because the good teams are supposedly very good and the not-so-good teams aren’t very good. But there are always upsets, like Villanova losing to North Carolina State. So the odds of a perfect bracket are still exceedingly long.
If it’s any consolation, the odds are also long for data whizzes. In last year’s Kaggle competition, eight different teams successfully predicted 46 or more of the final 63 games correctly, a 78 percent success rate. That’s better than a coin toss, but still pretty modest. “This is unsettling, and urges us to ask why our models didn’t perform as well as a naive model,” lamented a team of Harvard scientists in a paper describing their methods, which, along with five other entries, is reported in a special NCAA issue of the Journal of Quantitative Analysis in Sports.
Biostatistician Mike Lopez of Skidmore, who, with Loyola’s Gregory Matthews won the Kaggle competition last year, took a relatively simple approach. They tapped into the wisdom of Vegas and looked at the point spread, which reflects the relative talent of the two teams, leveling the betting playing field for uneven matches (a spread of -5.5, for example, says that the favored team is expected to win by more than 5.5 points). The statisticians also used metrics from basketball statistical maven Ken Pomeroy’s rankings, which include things like a team’s overall rating and offensive and defensive capabilities.
By using statistical models with point spread information and Pomeroy’s data, the statisticians had two sets of pretty accurate predictive probabilities. Lopez and Matthews then combined these two sets of predictions using a weighted average to predict the likely outcome of each game.
Lopez and Matthews did well, winning the $15,000 Kaggle prize. But being both modest and math-minded, they also looked at how much luck played a role in their own win. Depending how they tweaked the numbers in those simulations, they found the chances of them having the best entry in the Kaggle contest were as low as less than 2 percent.
“Even if you had the right predictions, you might not have luck on your side,” Lopez told me. Just deciding what data to include in your model can be fraught — that team from Harvard found for example, that using outcomes of games played during the regular season might have hurt their model.
Predicting things is hard — “especially about the future,” as Yogi Berra or Niels Bohr maybe said. (There, now I’ve used up my single allotted sports/physics cliché). Despite that difficulty, prediction science gives plenty of people a buzz. Kaggle holds dozens of competitions with stakes much higher than $15,000, and many are challenging problems in science. Corporations, nonprofits and others bring their data, their problem and their money to the company, which harnesses the power of hundreds of math lovers via the competitions. General Electric put up $600,000 in prizes to learn about solving problems with flight efficiency and hospital operations. An artificial neural network approach won a NASA-sponsored competition on detecting galaxies (prize: expense-paid trip to the Jet Propulsion Lab). Competitions that are currently under way include one sponsored by the California Healthcare Foundation on identifying diabetic retinopathy in eye images and using U.S. Forest Service data to predict types of tree cover for a given location.
Because predicting probability outcomes can be so challenging, you should abandon hope of getting a perfect bracket and just focus on beating your pool-mates, says Lopez. As he outlines on his stats website, figure out who your competition is picking and pick the opposite, making riskier picks the bigger your pool is. This strategy was working on a personal level for Science News Editor-in-Chief Eva Emerson, who until last weekend, was winning the office’s unofficial pool. Emerson tells me she just picked the opposite teams than those picked by her (more basketball savvy) partner. He currently has 68 points to her 75.
Our office pool has a consolation prize — the contestant with the worst bracket gets their $5 entry fee back. I have won this prize; my methods involves deciding if I like 1) the city/state of the team, 2) the colors/look of the uniforms, and 3) if the team name is fun to say, as in Gonzaga! (I weigh these variables arbitrarily). As of now, fellow blogger Sarah Zielinski is in the running for worst this year, but I like her strategy the best. Sarah picked teams based on a battle between their mascots. The University of Alabama at Birmingham posed a particular challenge, as their mascot is a dragon. “Fierce but imaginary,” notes Sarah. “According to my mixed-up logic, the dragon won until it went up against a human mascot (Duke) that pointed out that a dragon wasn’t real.” (The blue devil is technically human, a World War I–era French solider.)
Sarah’s final two came down to a battle between a pack of wolves (North Carolina State) and a bear (Baylor). This video decided the win.
