Marijuana and meth are getting more popular in America, but cocaine has declined
Spending on the drugs reveals shifts in use and abuse

Trends in drug use and spending are difficult to map. But a new analysis reveals that by 2016, users were spending more on marijuana than other drugs.
aee_werawan/iStock/Getty Images Plus
- More than 2 years ago
Illicit drug use lurks in the shadows — one reason it’s difficult to study. But public health researchers pull together numbers from surveys, overdose records and other sources to look for trends in how much people spend on drugs, numbers of users and frequency of use that can help policy makers fight substance abuse.
Now, an analysis released August 20 by the Rand Corporation estimates that people in the United States spent between $121 billion and $146 billion dollars annually on cocaine, heroin, marijuana and methamphetamine from 2006 and 2016. The analysis puts the drugs’ combined total on the same order as Americans’ annual alcohol tab, based on market research on the alcohol industry.
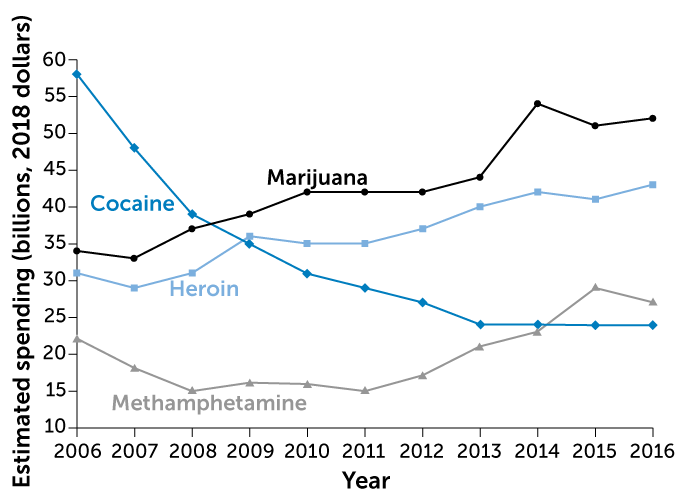
Among the four drugs, users in 2006 spent the most money on cocaine, around $58 billion (in 2018 dollars). But that spending on cocaine then dropped to $24 billion in 2016. Marijuana spending, meanwhile, roughly doubled to garner the greatest spending in 2016, at $52 billion.
Also, from 2010 to 2016, the number of people who had used marijuana in the last month increased from an estimated 25 million to 32 million, a roughly 30 percent increase. The uptick in cannabis consumption wasn’t a surprise, says report coauthor Greg Midgette, a criminologist at the University of Maryland and the RAND Corporation. In the United States, at least 1 in 4 people now lives in a state where recreational marijuana use is legal for adults over the age of 21.
Other trends also reinforce what drug policy experts knew about substance abuse in America. For instance, increasing heroin use from 2010 to 2016 likely reflects the opioid crisis (SN: 4/13/19, p. 32). But other findings were more surprising, Midgette says, such as increases in methamphetamine spending, users and consumption. From 2010 to 2016, the average purity of methamphetamine increased, and cost fell. “When the drug is available, pure and cheap, that’s troubling for public health,” he says.
Drug money
America’s drug users once spent the most on cocaine (blue), but spending has shifted towards marijuana (black) between 2006 and 2016. While methamphetamine spending (gray) has increased overall during this time, prices dropped while meth purity increased. Heroin spending (light blue) also increased, and numbers of chronic heroin users rose along with the amount of the drug consumed nationwide during this time.
Estimated U.S. spending on illicit drugs, 2006–2016

Source: G. Midgette et al/Rand Corporation 2019
Here are some of the report’s key findings about each drug:
Marijuana
- Total cannabis spending rose from an estimated $34 billion in 2006 to $52 billion in 2016, a roughly 50 percent increase.
- The number of chronic marijuana users, who used the drug on at least four days in the past month, increased from 14.2 million in 2006 to 22.8 million in 2016.
- Meanwhile, marijuana potency has increased (SN Online: 3/25/2015), making it more difficult to make meaningful comparisons about consumption over time, the researchers say.
Cocaine
- Cocaine consumption decreased from 2006 to 2010, from 384 pure metric tons to 143 tons. From 2011 to 2016, users consumed from 108 to 153 tons each year, the report estimates.
- Cocaine-related deaths have increased since 2010, with synthetic opioids like fentanyl contributing to the rise (SN Online: 5/1/18). It’s not clear why so many deaths include both cocaine and synthetic opioids, but the mixture may be dangerous and some cocaine may be contaminated with fentanyl or related drugs.
Methamphetamine
- The number of estimated chronic methamphetamine users, who use the drug four or more times a month, rose from 2.2 million in 2006 to 3.2 million in 2016. That’s more than for cocaine or heroin, each with 2.3 million users in 2016.
- During this time, the price of methamphetamine dropped, from $466 per pure gram to $171 in 2018 dollars. Average purity also increased, from 44 percent in 2006 to a whopping 94 percent in 2016.
Heroin
- From 2006 to 2011, heroin use in the United States hovered between 27 and 31 pure metric tons of the drug, the report estimates. Starting in 2011, use of the drug began to climb, reaching 47 tons in 2016, an overall increase of more than 40 percent.
- The researchers estimate that there were 2.3 million chronic heroin users in 2016, up from 1.6 million in 2006. But the number of chronic heroin users could be greater than double the estimate, the team says, since the available data may not reflect use in some populations.
- Unintentional heroin overdoses increased dramatically from 2006 to 2016, the report found (SN Online: 9/29/18). Mixing synthetic opioids, including fentanyl, with heroin resulted in a spike in deaths from 3,036 in 2010, when most cases didn’t involve a synthetic opioid, to 15,469 in 2016, when about 37 percent did.
The landscape of illegal drug use in the United States is difficult to map. The data are sparse and collected unevenly across the country, with more information on drug use generally available in urban areas than in rural places.
“This is hard work,” says Keith Humphreys, a psychologist at Stanford University who was not involved with the work. “It’s impressive that [the authors] were able to get this estimate together.”
But the report also highlights “how embarrassingly poor our data are” on monitoring drug use in the United States, Humphreys says. He points to now-defunded programs that had tested people arrested or admitted to emergency rooms for drugs. “We are underinvesting in monitoring a very serious public health problem,” he says.


